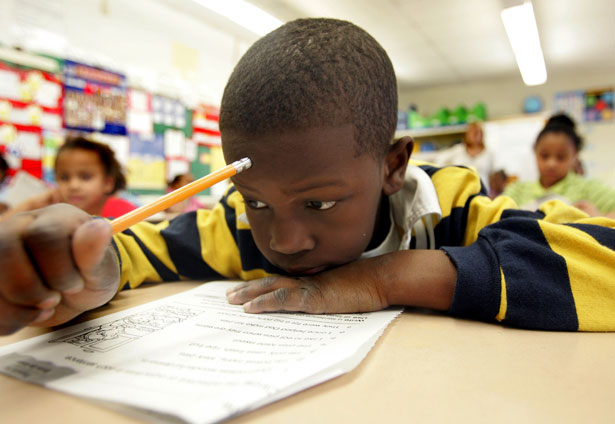
A research study by The United Negro College Fund (UNCF) entitled K-12 Disparity Facts and Statistics stated: College degrees are regarded as a primary vehicle for reducing poverty and closing the wealth gaps between people of color and whites. Yet, the disparities that exist are alarming.
STATISTIC #1:
African American students are less likely than white students to have access to college-ready courses. In fact, in 2011-12, only 57 percent of black students have access to a full range of math and science courses necessary for college readiness, compared to with 81 percent of Asian American students and 71 percent of white students.
Learn more in these sources:
• College Preparation for African American Students: Gaps in the High School Educational Experience
• U.S. Department of Education Office for Civil Rights Data Snapshot: College and Career Readiness
STATISTIC #2:
Even when black students do have access to honors or advanced placement courses, they are vastly underrepresented in these courses. Black and Latino students represent 38 percent of students in schools that offer AP courses, but only 29 percent of students enrolled in at least one AP course. Black and Latino students also have less access to gifted and talented education programs than white students.
Learn more:
• U.S. Department of Education Office for Civil Rights Data Snapshot: College and Career Readiness
• U.S. Department of Education Office for Civil Rights 2013-14 Civil Rights Data Collection “A First Look”
STATISTIC #3:
African American students are often located in schools with less qualified teachers, teachers with lower salaries and novice teachers.
Learn more:
• U.S. Department of Education Office for Civil Rights Data Snapshot: Teacher Equity
• U.S. Department of Education Office for Civil Rights 2013-14 Civil Rights Data Collection “A First Look”
STATISTIC #4:
Research has shown evidence of systematic bias in teacher expectations for African American students and non-black teachers were found to have lower expectations of black students than black teachers.
Learn more:
• Who Believes in Me? The Effect of Student-Teacher Demographic Match on Teacher Expectations
STATISTIC #5:
African American students are less likely to be college-ready. In fact, 61 percent of ACT-tested black students in the 2015 high school graduating class met none of the four ACT college readiness benchmarks, nearly twice the 31 percent rate for all students.
Learn more:
• The Condition of College and Career Readiness 2015: African American Students (a joint ACT-UNCF report)
STATISTIC #6:
Black students spend less time in the classroom due to discipline, which further hinders their access to a quality education. Black students are nearly two times as likely to be suspended without educational services as white students. Black students are also 3.8 times as likely to receive one or more out-of-school suspensions as white students.
In addition, black children represent 19 percent of the nation’s pre-school population, yet 47 percent of those receiving more than one out-of-school suspension. In comparison, white students represent 41 percent of pre-school enrollment but only 28 percent of those receiving more than one out-of-school suspension. Even more troubling, black students are 2.3 times as likely to receive a referral to law enforcement or be subject to a school-related arrest as white students.
Learn more:
• U.S. Department of Education Office for Civil Rights Data Snapshot: School Discipline
STATISTIC #7:
Students of color are often concentrated in schools with fewer resources. Schools with 90 percent or more students of color spend $733 less per student per year than schools with 90 percent or more white students.
Learn more:
• Unequal Education: Federal Loophole Enables Lower Spending on Students of Color
STATISTIC #8:
According to the Office for Civil Rights, 1.6 million students attend a school with a sworn law enforcement officer (SLEO), but not a school counselor. In fact, the national student-to-counselor ratio is 491-to-1, however the American School Counselor Association recommends a ratio of 250-to-1.
Learn More:
• American School Counselor Association
• U.S. Department of Education Office for Civil Rights 2013-14 Civil Rights Data Collection “A First Look”
STATISTIC #9:
In 2015, the average reading score for white students on the National Assessment of Educational Progress (NAEP) 4th and 8th grade exam was 26 points higher than black students. Similar gaps are apparent in math. The 12th grade assessment also shows alarming disparities as well, with only seven percent of black students performing at or above proficient on the math exam in 2015, compared to 32 percent white students.
Learn More:
• The Nation’s Report Card: 2015 NAEP Mathematics & Reading Assessments {title_1_4510}
There is a clear lack of black representation in school personnel.
According to a 2016 Department of Education report, in 2011-12, only 10 percent of public-school principals were black, compared to 80 percent white. Eighty-two percent of public-school educators are white, compared to 18 percent teachers of color.
In addition, black male teachers only constitute two percent of the teaching workforce.
Learn More:
• U.S. Department of Education: The State of Racial Diversity in the Workforce.